Google Analytics is implemented across all UC ANR websites. There is a single Google Analytics 4 (GA4) account that tracks activity on all ANR sites under the UCANR.edu domain.
In the past, individual ANR sites could use their own Universal Analytics (UA) or GA4 tracking IDs. However, with the shift to GA4 and centralized tracking, as well as IWP, all ANR sites now share one tracking ID managed by UC ANR.
Why Google Analytics?
Google Analytics helps you understand how visitors interact with your website. It provides valuable insights such as how people find your site, which pages they visit, how long they stay, and what actions they take. With this data, you can make informed decisions to improve content, increase engagement, and measure the success of your outreach or marketing efforts. For organizations like UC ANR, it’s a powerful tool to ensure websites are meeting user needs and achieving program goals.
How to apply for Google Analytics
- File a ticket requesting a Google Analytics account at iwp@ucanr.edu
- After gaining access to the Google Analytics account, you'll receive a an email from Google Analytics.
- Log in to Google Analytics using your [email]@ucdavis.edu or your [email]@gmail.com account.
How to use Google Analytics
- Go to All Accounts > UCANR > IWP Production.
- Go to /Reports/Engagement/Pages and Screens
- You can filter your results at the Date.
In the text box, type in your page: Screen Name such as IWP TRAINING - using Page Title and Screen Class
You'll also see the following for additional ways to set your page view:
- Page Title and Screen Class
- Page Path and Screen Class
- Page Title and Screen Name
If Page Title and Screen Class does not find the data you desire, you can experiment with the above settings to better find your data.
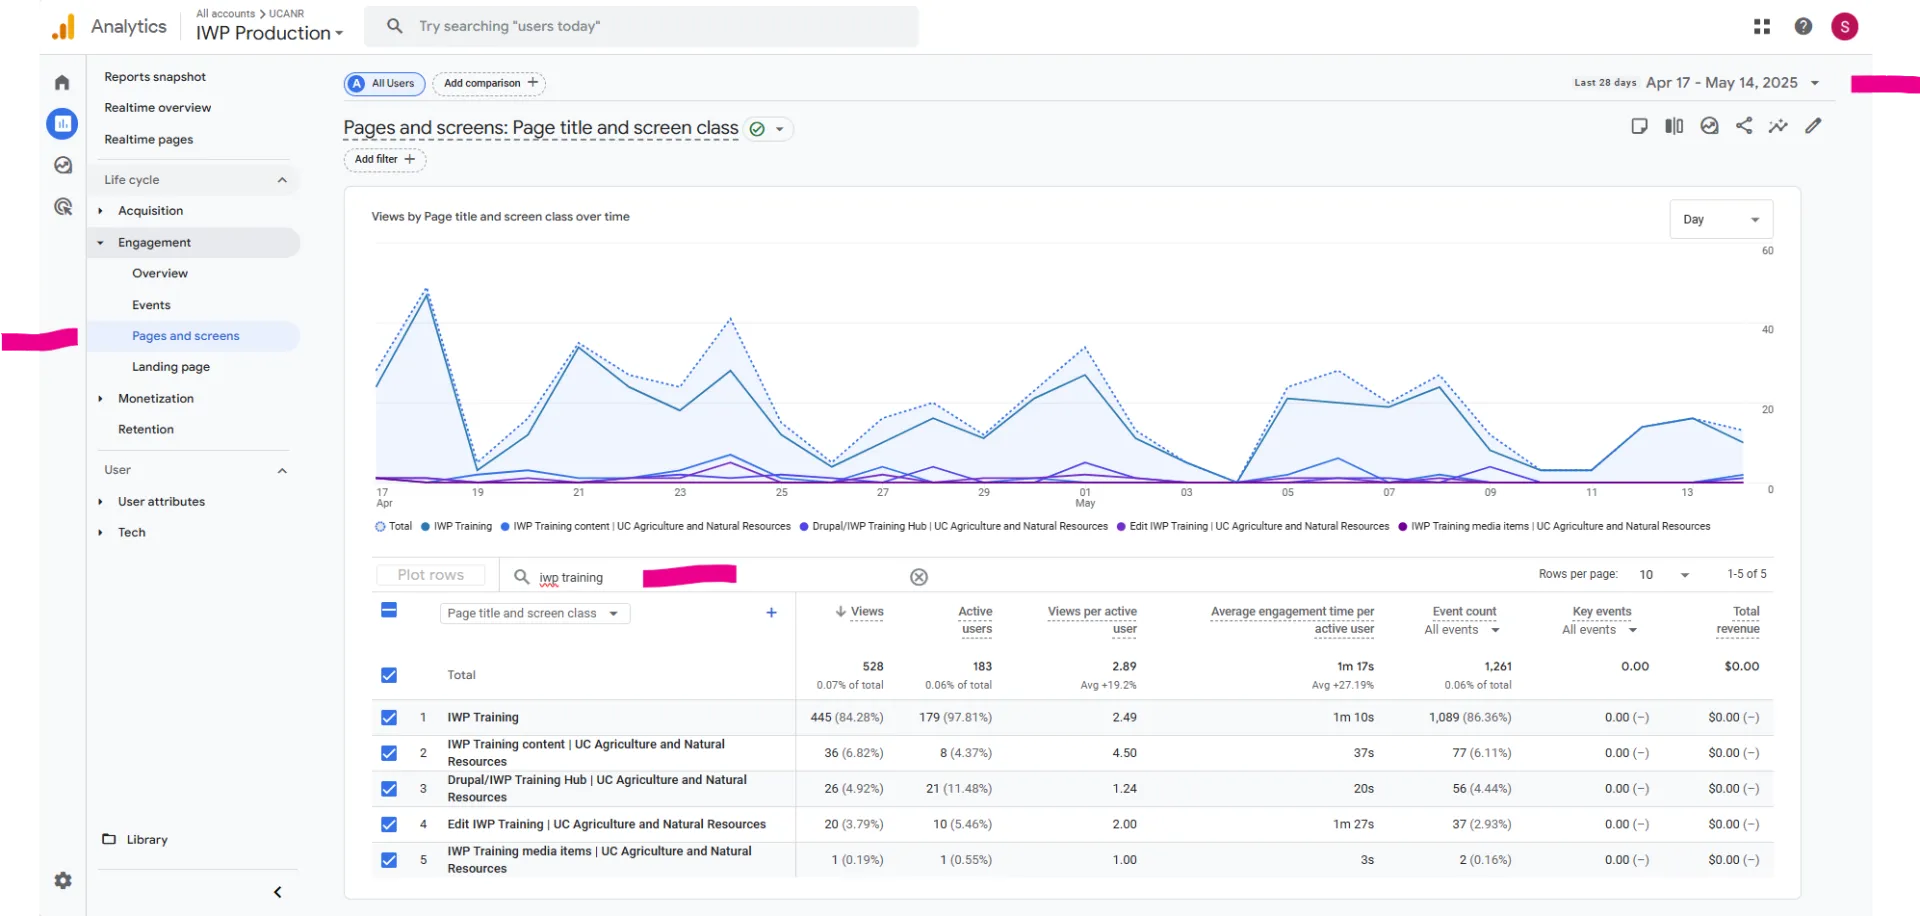
On this page you'll find the data for Views, Active Users, Views Per Active User, Average Engagement Time Per Active User, Even Count, Key Events, etc.
On Engagement > Event Count - Are user interactions tracked on a website or app. You can create and track custom events for various actions, like:
Views (page/screen views) - These are automatically logged by Google Analytics and represent the number of times a page or screen is loaded.
Active Users - Represent the number of unique individuals who have engaged with your website or app within a specific time period.
Views Per Active User - Refers to the average number of page views or screen views per unique user who actively interacted with your website or app. It's a metric that helps understand how engaged users are with your content.
Event Count - A metric that tracks the total number of times specific user interactions, or events, occur on a website or app.
All Events - Events are categorized into four types: automatically collected, enhanced measurement, recommended, and custom events.
Add to Any Share -Enable Social Interaction Tracking in your Google Analytics settings.
Click - Tracking when a user clicks a specific button on a webpage.
First Visit - Number of times your users visited your site for the first time.
Scroll - Measurement of how far a user scrolls on a page.
Search - Number of times users used the page search in the top nav.
Session_Start -When a user visits a website or opens an app and is active, or when the previous session has timed out due to inactivity.
User_Engagement - Event is triggered when users engage with the website.
View_Search_Results - Event tracks each time a page_view event occurs on a site search results page, as well as they keyword (query) that was used in each site search.
Along with the Engagement and all it's attributes you'll also see Acquisition and it's attributes. We recommend you experiment with them all.
To learn more about Google Analytics, please visit Google Analytics Marketing.
How to Set Up Google Search Console.