As an advisor or a county director, you may want to insert a map of your county and overlay with relevant layers. Or you may want to explore different variables such as income and housing or population characteristics for the purpose of program planning. Thanks to GeoAI, making a map for your county or getting a report of demographics or a community snapshot will just become easier. ESRI is powering GeoAI into tools such as Business Analyst. With this, you can ask AI to create a map of your service area or you can ask the Assistant to provide you with reports or infographics for your service area.
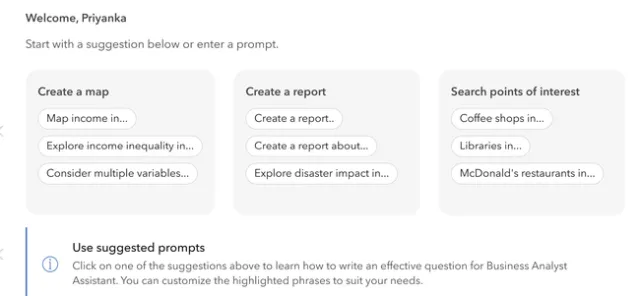
To get started with the AI Assistant, ESRI has some prompts to help such as “Create a Map of Income in California” or “Map income inequality in Denver” or “Create a map of population and income in Boston”. With the default prompt , you have to simply substitute your geographic area or change the variable. You can also use the Assistant to provide you reports related to demographics, or a report about retail or the impact of a disaster. Below are the examples of the prompts you can use with minor tweaks based on your service area.
“Make a map of Placer County, California”. This will spit a map for your county. It gives
“ESRI's GeoAI is still in beta stage and is trained to tackle multiple variables but not multiple geographies yet,” said Jason Latoski, Senior Solutions Engineer for State and Local Government at the CalGIS 2025 Conference in Rohnert Park.
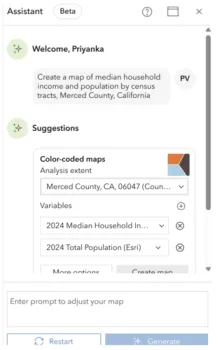
Here is an example of mapping two variables for Merced County. I gave a prompt, “Create a map of median household income and population by census tracts for Merced County”, and you have a bivariate map. This means one still needs to know how ESRI's bivariate symbology works and how the data are classified into different bins to produce the map pattern that one sees. Apart from maps, you can also ask AI Assistant to provide a report for your service area based on the thousands of variables that are already available.
What AI Assistant is still learning?
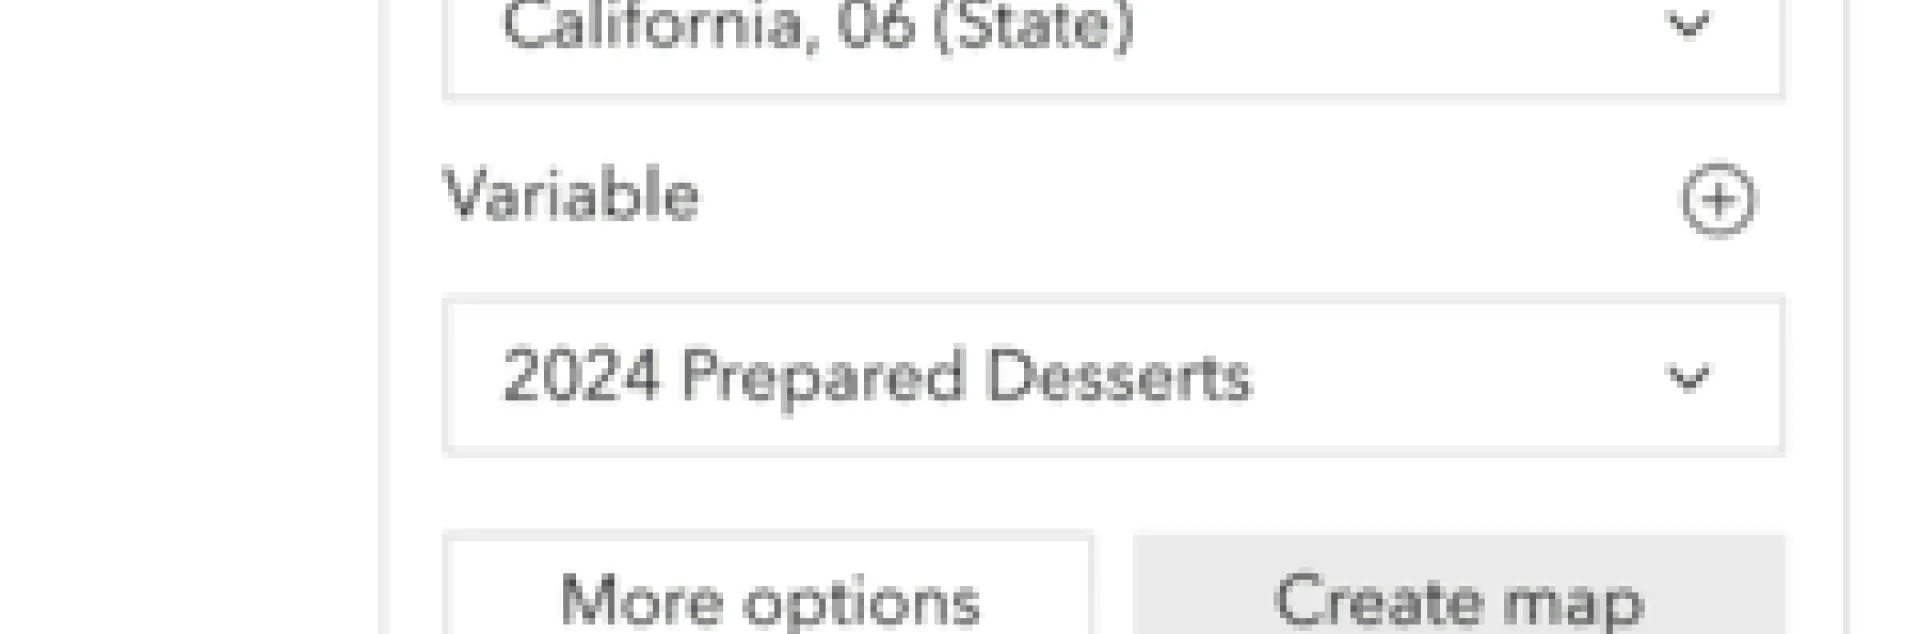
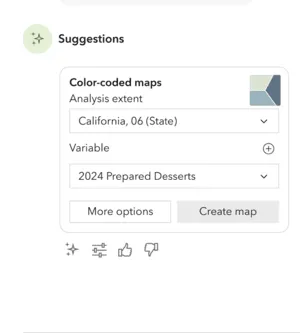
Terms that are common in specific fields such as “food desert” is something that an AI Assistant will have a hard time comprehending. While this is a term that food and nutrition researchers, advocates, and practitioners widely use, an AI Assistant will take this term literally and show you places that sell desserts or may not be able to provide you with any map.
Another term I tried with was community-based organizations and it yielded no results. When I refined the term to faith-based organizations, it gave several indicators to choose from. These options are based on the built-in datasets such as Data Axle, Safe Graph, Census among others.
 Key takeaways:
- AI Assistant can be great starting point but it is good to know the basic GIS terminology.
- AI can help you make a map but you still have to know the data sources it is using and the measures that were used to generate the map.
- AI Assistant searches for the datasets that are in-built in ESRI's Business Analyst tool. So familiarizing with the various datasets that are in-built is a good starting point.
- AI doesn't replace the need to know the fundamentals of map symbology and classification. While AI can create a map based on two variables, the onus is on the user to know the strength and weakness of the default symbology, how to interpret the map correctly, and go beyond the default.
“Business Analyst has thousands of variables and has data from multiple sources. As people are getting started with using AI Assistant, it is good for them to be acquainted with what's in here. Using the exact name of the variable that are in these datasets can be helpful when writing prompts”, said Delia Wahby, Solutions Engineer at ESRI.